DORA Metrics 101: 4 Key DevOps Measures to Boost Delivery
In the ever-evolving world of software development, one question remains constant: how do you measure and improve the speed and reliability of software delivery? Enter DORA metrics—a set of performance indicators that have become the gold standard for evaluating and optimizing DevOps practices. Whether you're part of a lean startup or a large-scale enterprise, understanding and leveraging DORA metrics can transform your development pipeline.
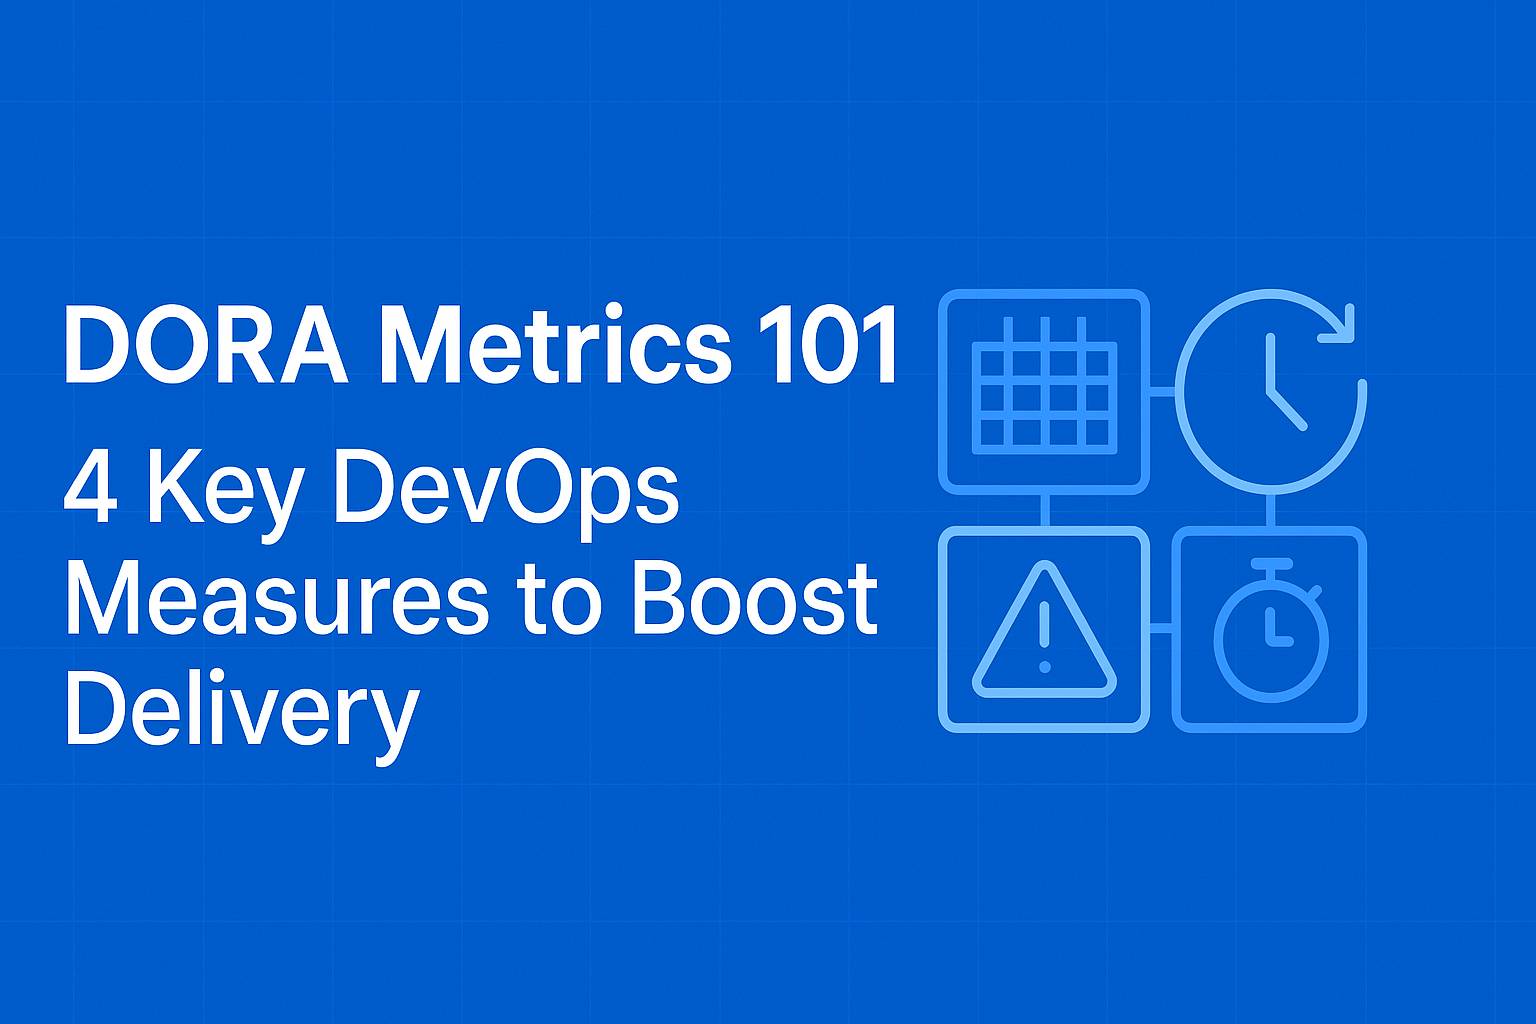
This beginner-friendly guide will break down each of the four key DORA metrics—Deployment Frequency, Lead Time for Changes, Change Failure Rate, and Mean Time to Recovery (MTTR)—and explain why they matter. More importantly, we'll explore how tracking these DevOps performance metrics can help you identify bottlenecks, boost team performance, and deliver software faster and more reliably.
What Are DORA Metrics?
DORA stands for DevOps Research and Assessment, a research team that originated from Google Cloud. Their groundbreaking Accelerate State of DevOps reports revealed that a handful of key metrics could effectively measure the performance of software development and delivery processes. These DORA metrics are:
- Deployment Frequency (DF)
- Lead Time for Changes (LT)
- Change Failure Rate (CFR)
- Mean Time to Recovery (MTTR)
Together, these four metrics offer a comprehensive view of how quickly and reliably your team can deliver software, recover from incidents, and maintain system stability.
1. Deployment Frequency (DF)
Definition: Deployment Frequency measures how often new code is deployed to production. It reflects your team's ability to deliver updates and features consistently.
Why It Matters: Frequent deployments indicate a healthy, agile workflow and often correlate with smaller, less risky changes. Organizations that deploy multiple times a day can respond faster to user feedback and market demands.
How to Improve:
- Automate your CI/CD pipelines
- Break features into smaller, incremental changes
- Foster a culture that encourages rapid, safe delivery
Even small teams can benefit from tracking deployment frequency by setting achievable goals and refining their processes.
2. Lead Time for Changes (LT)
Definition: Lead Time for Changes measures the time it takes for a code commit to reach production. This metric reflects how quickly your team can deliver new features or bug fixes.
Why It Matters: Short lead times mean that ideas and fixes are delivered to users faster, increasing your team's responsiveness and business agility.
How to Improve:
- Streamline code review and approval workflows
- Use feature flags to separate deployment from release
- Invest in automated testing to speed up validation
Reducing lead time is a clear way to improve software delivery speed and remain competitive.
3. Change Failure Rate (CFR)
Definition: Change Failure Rate tracks the percentage of deployments that result in failures, such as bugs or outages.
Why It Matters: A low CFR indicates a robust development process where issues are caught early. High CFRs can erode user trust and lead to costly downtime.
How to Improve:
- Improve test coverage (unit, integration, and E2E)
- Conduct post-mortems and root cause analyses
- Encourage a blameless culture to learn from mistakes
This metric encourages balance between speed and stability.
4. Mean Time to Recovery (MTTR)
Definition: MTTR measures how long it takes to restore service after an incident or failure.
Why It Matters: Downtime is inevitable, but the speed of recovery affects customer trust and operational costs. A lower MTTR reflects strong resilience and preparedness.
How to Improve:
- Use real-time monitoring and alerts
- Practice incident response with runbooks
- Promote cross-functional collaboration during outages
A lower MTTR ensures your system can bounce back quickly, minimizing the impact of unexpected failures.
Why DORA Metrics Matter
DORA metrics aren’t just buzzwords or management KPIs. They reflect your team’s real-world ability to innovate, ship, and maintain software. They help teams:
- Identify inefficiencies in the pipeline
- Prioritize improvements
- Measure the impact of changes
- Align engineering efforts with business goals
When tracked consistently, DORA metrics turn gut feelings into data-driven insights.
Getting Started with DORA Metrics
You don’t need to be a Fortune 500 company to benefit. Tools like GitHub Actions, GitLab, CircleCI, and Jenkins often already provide the necessary data. There are also platforms like Sleuth, LinearB, and Velocity specifically built for DORA metrics.
Start in 4 Steps:
- Choose one or two metrics to focus on
- Collect baseline data
- Share with your team and set improvement goals
- Track progress regularly
Improving delivery speed and quality is a journey. DORA metrics give you the map.
Final Thoughts
In a landscape where speed, reliability, and innovation define success, understanding DORA metrics explained clearly can be a game-changer. By focusing on these four metrics, teams can uncover their strengths and resolve bottlenecks.
Whether you're building a product, scaling a platform, or improving your pipeline, DORA metrics offer the clarity you need to move faster, safer, and smarter.